SEM, Me, and Bobby McGee
The highlight of my media career is undoubtedly being called a “media anarchist” in 2008 when I pointed out to the industry that once you start splitting the 10 LSM segments, you de facto create more LSM segments. 17 LSM segments by last count in AMPS 2015AB.
Of course, there are still people who insist there were only 10 LSMs but, by and large, these are essentially the same people who throw away perfectly good food because of the “Best Before” stamp on the packaging.
So, when it was announced that the Establishment Survey (ES) SEM model consisted of only 10 segments, I did feel a little disappointed. Not quite like I was being dragged screaming off a United Airlines flight but certainly a bit like I’d been downgraded from business class.
As we have seen from my previous blog, even for a Media Twit like me, reweighting from AMPS-LSM to the new SEM (Socio Economic Measure) is doable if you have a pin, a piece of string and a ruler, and you like playing “Where’s Wally”. Its predictable and it lacks targeted granularity though, so as with LSM, the key to using SEM is to create clusters that best reflect your point of focus.
Well, you can only begin to imagine my excitement when I discovered that not only can the SEM model also be segmented into 17 segments but that you can create as many segments as you want. Up to 100 in fact.
Yes! That’s what that mysterious “SEM Actual Value” coding line is for in Telmar.
SEM is not so much a pre-packaged segmentation tool, as it is a continuum. As media planners (I’m still a media-planner even though the phrase lacks the cachet of being a channel-strategist), we can determine precisely where on the continuum we want to focus our communication. Of course, reliability of sample sizes is questionable but ultimately, it’s insights we’re after in media these days, not nth degree factual observations. Well, at least that’s what I’m told by the big-data converts.
For instance, we can target the Top End of the market (Top 23% – SEM score 78-100). Or we can target the Top End of the market (Top 14% – SEM score 87-10). Or we can target the Top End of the market (Top 10% – score 91-10 or SEM 10).
You see where the problem lies? There is no convention. Your Top End and my Top End may be completely different. Indeed, we can choose to segment that market into whichever configuration suits our purpose. Now, I’m not normally a betting man (too many years as an Arsenal supporter) but I’m willing to bet that SABC TV, DSTV and ETV will all have a very different SEM segmentation offering. As will KayaFM, 702 and PowerFM.
It’s a bit like “Black Diamonds 2”. Everyone will be free to use the SEM data as they see fit. Yes, it’s the democracy of data-usage but I’m with Bobby McGee on this one; “freedom’s just another word for nothin left to lose”.
It’s not enough for ES to dump this new data-template on the market without detailed explanations and guidelines. For instance, if this is a better representation of South Africa’s Gini-coefficient then why is it a continuum? Why isn’t the shift quantum? A perfect continuum on a “have and have-not” scale doesn’t seem to mirror disproportionate distribution of economic wealth. What clustering conventions would best represent the reality of Mzansi’s Gini-defined economic circumstances?
ES needs to engage with the media industry and start training and workshopping with data-users. The ES stakeholders need to explain what the differences are between AMPS and ES (and LSM and SEM); not statistical and research-based differences, but actual hands on application in a live planning situation. And they need to do this before the reweighted ES-TAMS data goes live in June.
It’s simply not enough to launch and then just walk away.
Let’s get back to clustering the data. If the Muller LSM Cluster Model[1] works as a usable segmentation tool (and it does), then can it be used to position SEM in the recognizable media landscape?
ES LSM uses the same defining variables as AMPS but there has been some re-weighting of the populations, so the Muller Cluster Model is constructed slightly differently in ES.
- Traditional Market: LSM 1,2,3 (6,2% Pop)
- Transitional Market: LSM 4,5 (35,7% Pop)
- Middle Market: LSM 6 (33,6% Pop)
- Upper Middle B: LSM 7,8 (16,0% Pop)
- Upper Middle A: LSM 9 (5,5% Pop)
- Elite: LSM 10 (3,0%)
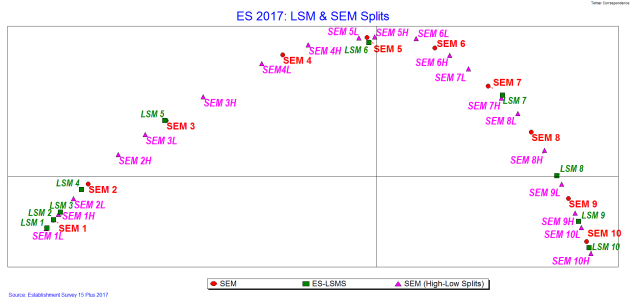
By creating midpoint splits for SEM, in the same way that LSM was split in AMPS, we can juxtapose ES-SEM against ES-LSM. The “arch” is reassuringly familiar and we can discern some apparent correlations between the competing segmentation tools. LSM10 and SEM10 for instance are easily located at the “top end” of the market continuum.
There are also some significant points of difference, particularly at the “bottom-end” of the market e.g. LSM3 & SEM3 or LSM 4 & SEM 4.
If you want to use the SEM data as a segmentation continuum, be my guest, but migrating from existing LSM segmentation practices to SEM, is extremely difficult. If you want a landscape that is more familiar, something that positions your old segmentation parameters in ES, then clustering proves a much more workable solution.
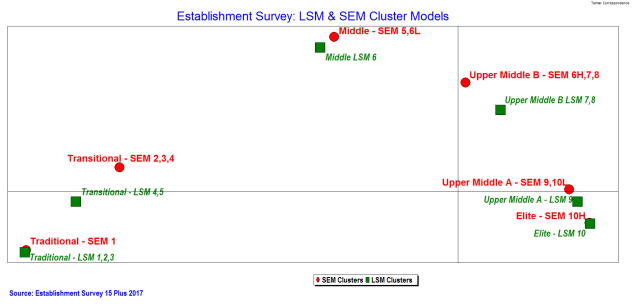
The following parameters provide a day-to-day usable framework.
- Traditional Market
- ES LSM 1,2,3 (6,2 % Pop)/ ES SEM 1 (12,6% Pop)
- Transitional Market
- ES LSM 4,5 (35,7% Pop)/ ES SEM 2,3,4 (40,8% Pop)
- Middle Market
- ES LSM 6 (33,6% Pop)/ ES SEM 5,6L (14,6% Pop)
- Upper Middle B
- ES LSM 7,8 (16,0% Pop)/ ES SEM 6H,7,8 (20,1% Pop)
- Upper Middle A
- ES LSM 9 (5,5% Pop)/ ES SEM 9,10L (8,7% Pop)
- Elite
- ES LSM 10 (3,0% Pop)/ SEM 10H (3,3% Pop)
In addition, when creating broader target parameters, if you use the “1-up:1-down” rule of thumb then discernible and differentiating media consumption patterns will emerge. So, target Middle & Transitional (SEM6L-SEM2) or Middle & Upper Middle B (SEM5 – SEM8) but don’t try and target Transitional through to Upper Middle B for instance; there is simply no cohesive media consumption pattern.
I have no doubt that the statistical bean-counters will take exception to this solution but I in turn make no apology for being a Media Twit, whose job it is to develop coherent and usable marketing and media insights for advertisers.
You want statistical perfection, then buy an algorithm.
Of course, if we had Product consumption and Brand information multi-based into ES, then none of this would be necessary, because we would be able to immediately locate our targeted brand consumers on the new ES landscape.
But that’s another journey entirely and although the song says, “I’d trade all of my tomorrows for one single yesterday”, right now it is all about what we’re going to do today.
[1] Marketing in South Africa – Simpson & Lappeman http://www.vanschaiknet.com/book/view/392

Reply